De Prado — finance in ML as explorable knowledge
My experiment and research: turn a dense book on financial ML into a tool you can play with and test ideas against. Here's why, and the decisions behind it.
Why
"Advances in Financial Machine Learning" by Marcos López de Prado is a dense book: formulas, algorithms, non-obvious techniques. Reading it passively means carrying away almost nothing. I wanted to test the idea of explorable explanations: what if you turn anemic text into a working instrument for exploration — one where a technique from the book can be not just read, but turned by hand so you feel how it behaves.
This is my personal experiment and at the same time research — both into the domain (the structure of financial data) and into the format of presenting knowledge. The pedagogical bar I set myself: a good explorable doesn't illustrate, it lets you create — it carries the reader along the path "understanding → action → new knowledge".
How it's built
The site is built on Astro: the prose is static (formulas render through KaTeX at build time, the styling is in the Tufte spirit with margin notes), and JavaScript loads only where there's interactivity. The interactive "islands" are written in Elm (InfoBars, ReturnsDist, ImbalanceClock); a thin glue layer in TypeScript registers each Elm module and wires it to the page through ports.
On top of that — a few of my own Astro components: Explorable (the island card), Drive (controlling a widget's state from the text), RunJS (code runnable right in the page), Margin (margin notes), ImbalanceFig (SVG built at build time).
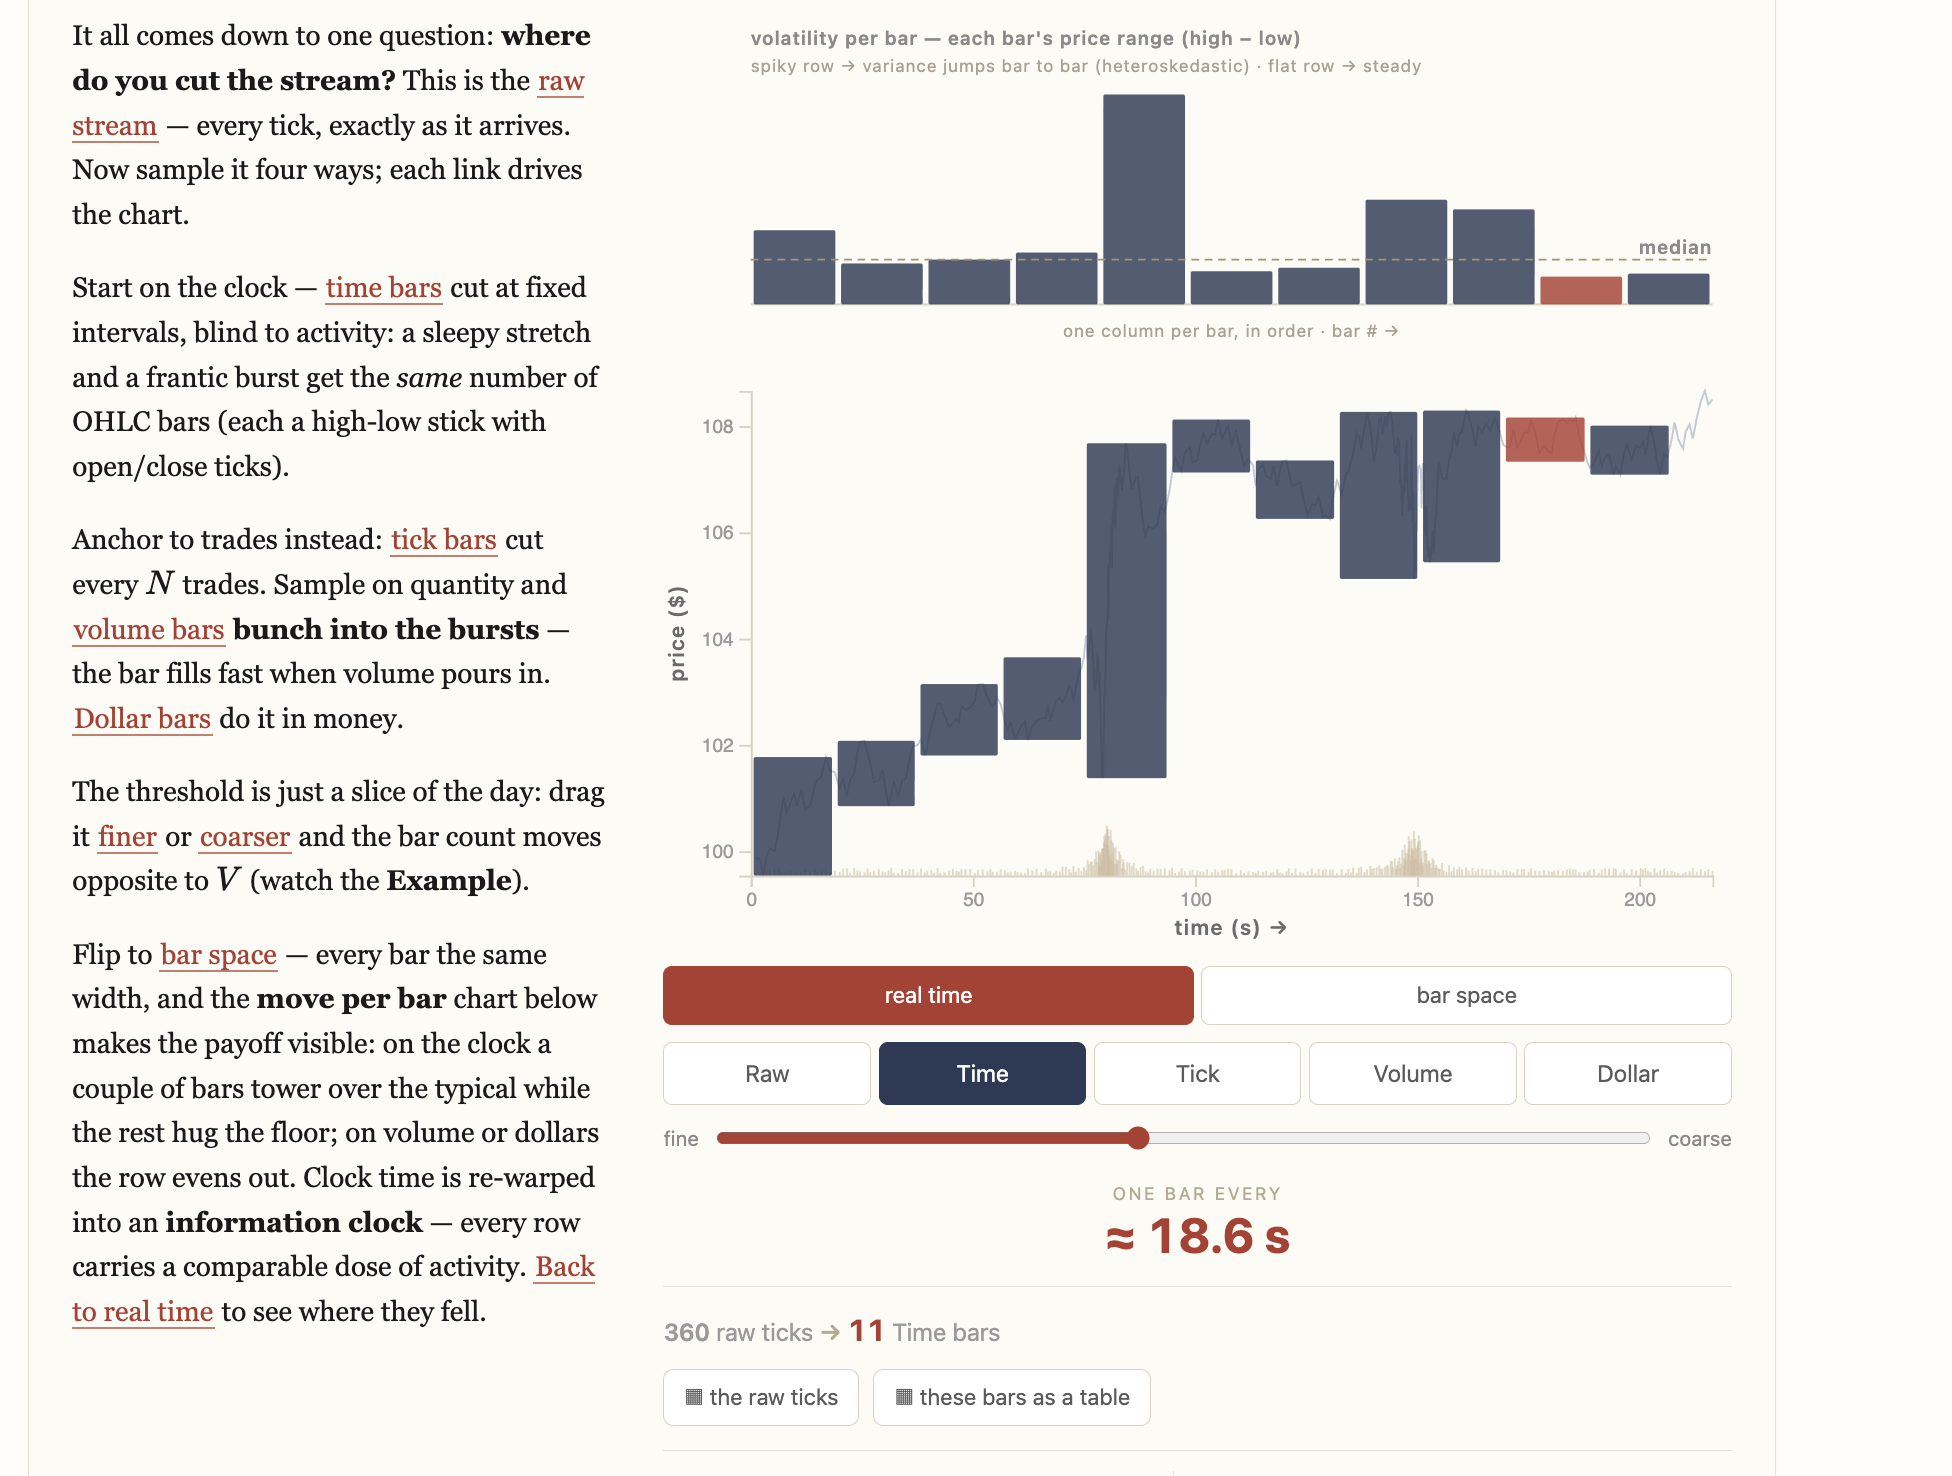
Drive component.Decisions I made on this project
Islands, not an SPA
By default the page is text and formulas rendered statically. Interactivity arrives as pinpoint islands where it's needed, rather than wrapping the whole site in an application.
Why: the genre here is reading, not "an app". The prose has no reason to pay for a framework's runtime; the formulas should be visible and indexed immediately, without waiting for JS. Astro islands give exactly that — the static content is fast, and the heavy interactivity is isolated within its own boundaries.
Widgets — in Elm
Each island is an Elm program along the TEA architecture, plugged in through ports.
Why: an island is a small stateful application (sliders, modes, chart redraws), and this is exactly where the cost of a state bug is high. Elm gives a guarantee at the compiler level: no null/undefined, an incorrect state simply doesn't assemble. For interactivity that has to work reliably unattended, that's an ideal trade — and at the same time a check of the thesis that the functional approach pays off in practice.
The prose drives the widget's state
Through the Drive component, a link right in the text sets an island's configuration: the reader clicks a phrase — and the widget moves into the right state (highlights a mode, sets a threshold). The link goes through an apply port in Elm.
Why: this is the essence of an explorable — the text and the tool don't live apart. The explanation leads the reader through a scenario, and at that moment the widget shows exactly what's being discussed. The result isn't "text plus a toy next to it" but a single line of thought.
One skeleton for all bars → a sandbox
All the bar types from the book are one formula: θ += w(tick); cut the bar when θ ≥ threshold. The four "different" bars differ only in the weight function w (time / 1 / volume / price·volume).
Why: once they see the common skeleton, the reader stops cramming four recipes and grasps the principle. And then — the climax I'm building the project toward: a sandbox where the reader sets w themselves. At that moment the tool turns from "four presets" into a means of creation — you can invent your own bar (by volatility, by spread, by flow toxicity). That's "understanding → action → new knowledge" in action.
What exists and what's ahead
Chapter 2 ("Financial Data Structures") is built out substantively: original prose with formulas and code, three working islands, an algorithm runnable right in the text via RunJS, "these bars as a table" modal tables — tying the visualization to the numbers underneath it.
What's ahead: the sandbox with a user-defined w (the main next step), a CUSUM filter for §2.5, loading real tick data instead of synthetic. Honestly: the project is young — it's a research testbed, not a finished product; the mobile layout of the islands needs tidying, and for now it's one chapter out of many.
The project will be open-sourced soon — a link to the live demo will appear here then.